
"I can't say how IMPRESSED I am with the reliability of your software. 48 hours of market insanity and not a hickup! DTN/IQFeed is my provider. Thank you for your product!"—David T, Florida |
The foundational MarketDelta® product, MarketDelta® Standard offers the core Footprint® chart, multi-pane charting, technical analysis and market monitoring features of the product line.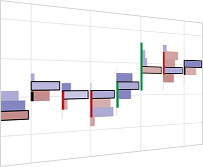
Footprint® ChartsPre-trade price transparency was revolutionized by Level II quotes screens and the Depth of Market (DOM) order book. The Footprint® chart is revolutionizing post-trade price transparency by displaying price AND volume activity on one data point and over any time frame you specify. Footprint—What it isA Footprint® is an individual price painted on the chart with a unique color that contains volume or some other market statistic. Stacking Footprints together creates bars, similar to what any candlestick or bar chart would present. The primary difference, and thus advantage of the Footprint®, is it shows each individual price within a bar AND displays value added information such as volume at price, buy/sell pressure, and other valuable statistics. You can even create custom indicators based on this information! 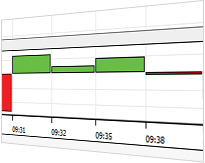
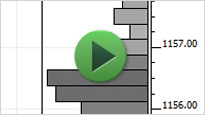
Market Profile®Start categorizing market generated data the way professional traders have for the past 25 years. Market Profile® provides a graphic that is statistically based and provides an intuitive way to organize market data into distributions. Market Profile® provides traders with a structure to organize price activity in a logical way and find where "value" is being created.
Download Education: Value Area Basics (Fact Sheet)

Feature ThreeMarkets like to probe. Price will take a stab at a new high to see if there is any trading interest above the current high. Or price may probe the lows and find it triggered a sell-off. Any which way you look at it, price gets probed by the buyers and the sellers. While prices are being probed by the buyers or sellers their mark is left behind with volume.
Download Education: Value Area Basics (Fact Sheet)
Delta FootprintStart categorizing market generated data the way professional traders have for the past 25 years. Market Profile® provides a graphic that is statistically based and provides an intuitive way to organize market data into distributions. Market Profile® provides traders with a structure to organize price activity in a logical way and find where "value" is being created. |